Hi there!
As ImprovMX grows, many of you have asked for better visibility into your email activity. We're excited to share that ImprovMX now has a Usage Dashboard, a dedicated page where you can see exactly how many emails you've sent and received, broken down by domain.
How to access the Usage Dashboard
- Log into your ImprovMX account
- Click on Usage Dashboard from the navigation menu
What you'll find
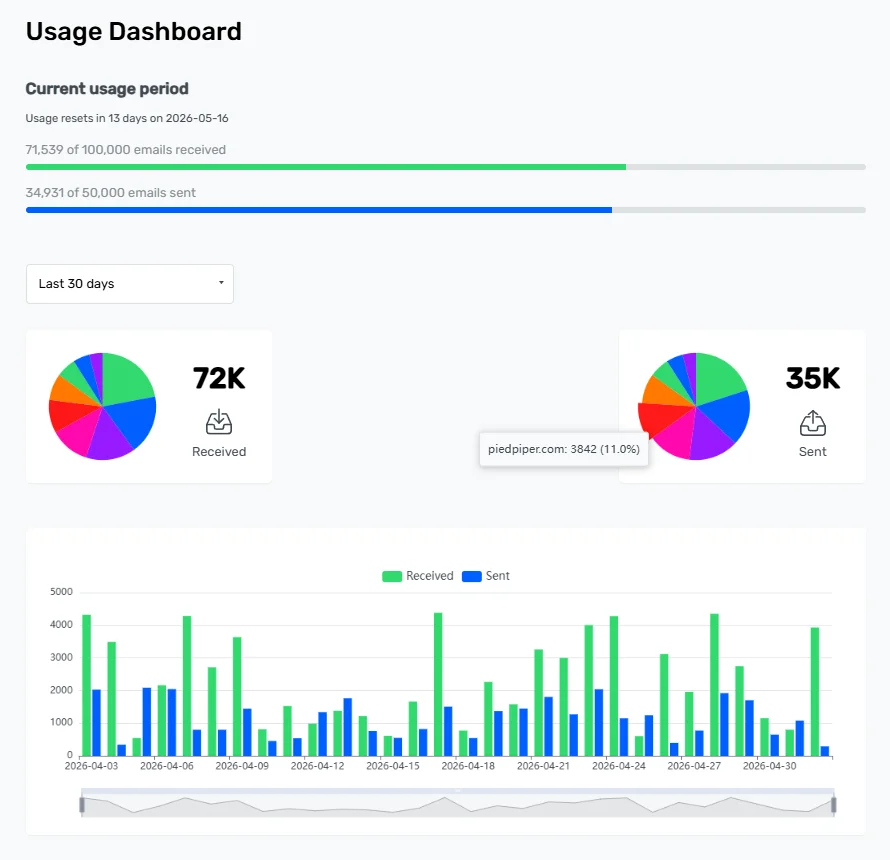
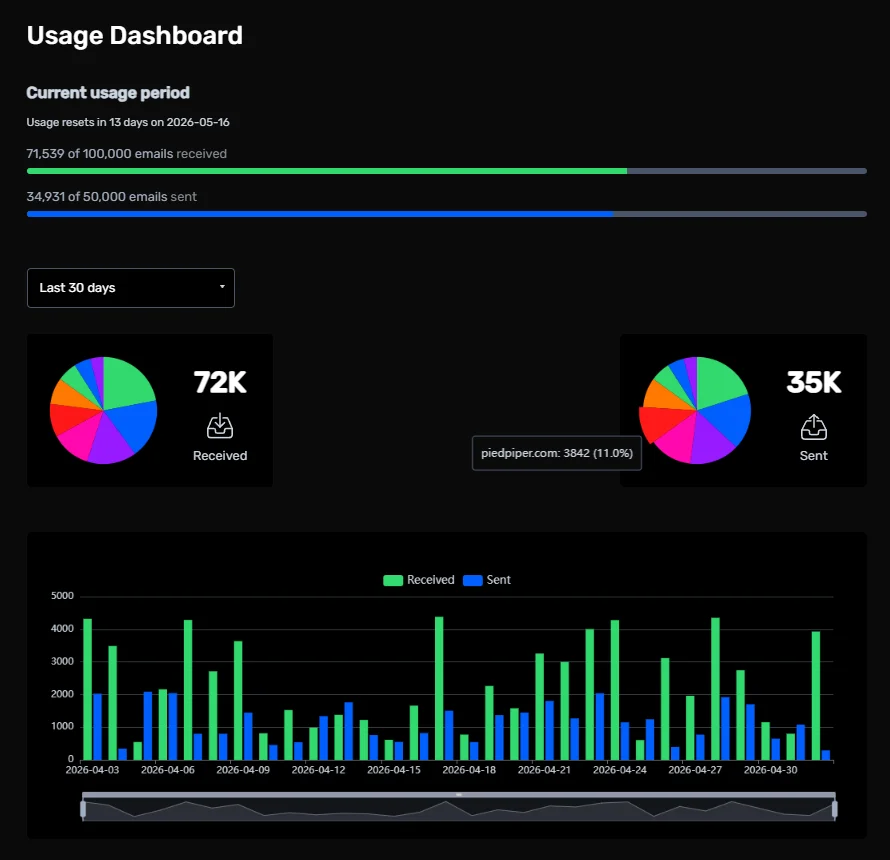
Sending and receiving totals - See how many emails you've sent and received across all your domains.
Per-domain breakdown - Pie charts show you which domains are driving the most sending/receiving volume.
Daily trends - A bar chart plots your daily email activity, so you can see how your usage fluctuates over time.
As always, you can check out our public feature roadmap on GitHub and share your ideas. If you have any feedback, reach out via our contact page - we'd love to hear from you.
Thanks,
Yosif Gorelyov
Fullstack Developer @ ImprovMX

Yosif Gorelyov
Fullstack Developer